The 2022 U.S. Trans Survey dropped their health and wellbeing findings report in June. This is a data results from a 2022 survey of 92,329 trans and nonbinary individuals aged 16+, from people living in all 50 states, Washington D.C., and several U.S. territories and military bases overseas. The survey was available in Spanish and English.
Yep, almost 100,000 of us.
Reports available from the data:
- Early Insights (released in February, 2024)
- Civic Engagement (released in August, 2024)
- Health & Wellbeing (released in June, 2025)
Highlights from the Early Insights report (we wrote about it here!):
- The largest study ever done on the experiences of binary and nonbinary trans people in the United States
- Living openly as ourselves and having access to care is fundamental to thriving.
- Almost half of use, even in 2022, considered leaving our home state because of discriminatory laws.
- Almost half of us had negative health care experiences in the year prior to the survey.
- We don’t feel safe asking law enforcement for help.
- Half of us do not have an identity document reflecting the names we use, and more than half of us don’t have an identity document with our gender represented.
The Health & Wellbeing findings report focuses on our access to healthcare, our experiences with healthcare, our overall happiness and life satisfaction, and our rates of substance use. When compared to the 2015 survey and results, it is an amazing tool to document change, resilience, and the problems we still face (or are facing anew, as trans care becomes increasingly politically restricted in 2025).
Key Findings From the 2022 Trans Survey
on Provider Knowledge and Getting Care
- 57% of us have a dedicated transition-related healthcare provider. This is more than the 44% of us who did in 2015.
- 19% of us see the same healthcare provider for primary care AND transition care. This is down a lot compared to 2015 (51%).
- 39% of us have a different healthcare provider for primary care.
- 42% of us don’t get routine healthcare.
Of those of us who have a transition provider, 77% said that their provider knew what they were doing.
Of those of us who got primary care from someone other than a transition expert, only 8% said that their primary care provider knew what they were doing.
On Getting To Our Appointments
- We are twice as likely to have to travel more than 50 miles for gender care compared to 2015. (11% of us compared to 5% in 2015).
What Does This Mean?
We STILL do not have enough providers that we can trust for either our primary care needs or our transition-specific needs. We need more affirming and knowledgeable healthcare providers.
We need more training at all levels of healthcare education, for all kinds of providers, not just those interested in family medicine, internal medicine, or endocrinology. (Hey! Are you a provider who wants education? Check out QueerCME!)
We need to expand access to care, especially in rural areas. We need more telehealth, not less, and we need more providers.
On Gender Care, Specifically
- 88% of us said that we wanted gender affirming hormone therapy.
- 56% of us said that we had ever gotten any.
- 60% of us got some kind of gender affirming medical care.
That’s 32% of us who WANT care and haven’t gotten it.
- Of those of us who had ever started hormones, 90% of us were still taking hormones at the time of the study.
- 29% of us reported getting some kind of gender affirming surgery.
- 98% of those of us who were taking hormones said that HORMONES MAKE OUR LIVES BETTER.
- 97% of those of us who had gotten surgery said that SURGERY MAKES OUR LIVES BETTER.
On Persisting
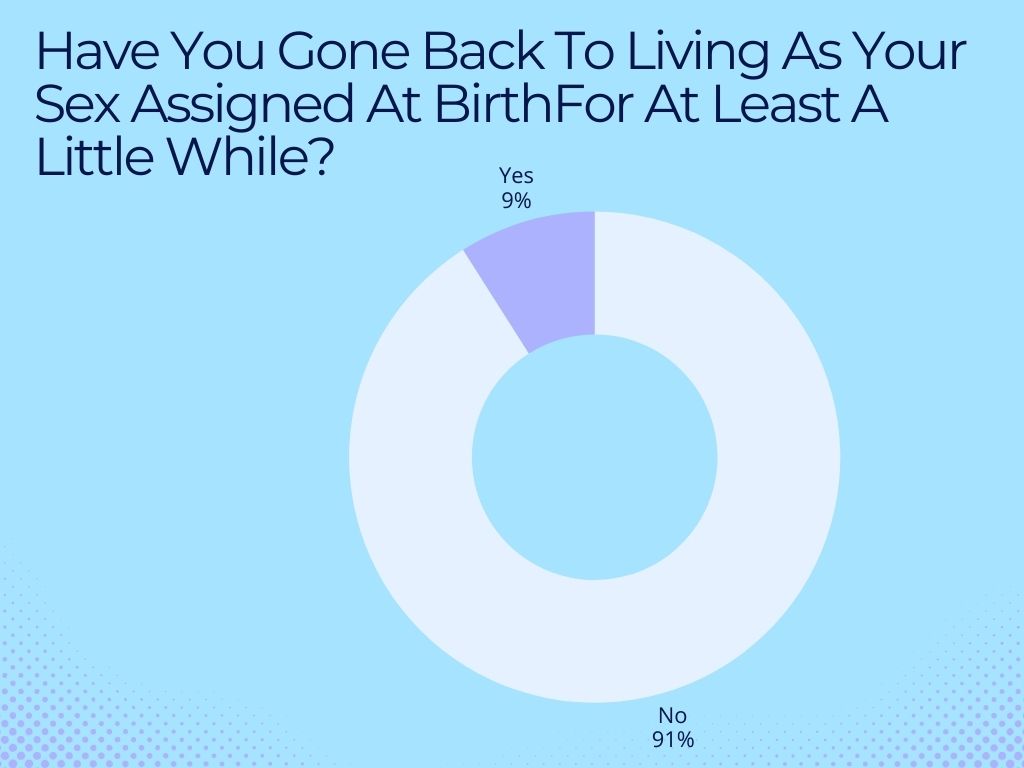
- The survey asked “Have you gone back to living as your sex assigned at birth at least for a little while?”
- 64,843 of us answered, and 91% of us said “No.”
- 9% of us answered “Yes.”
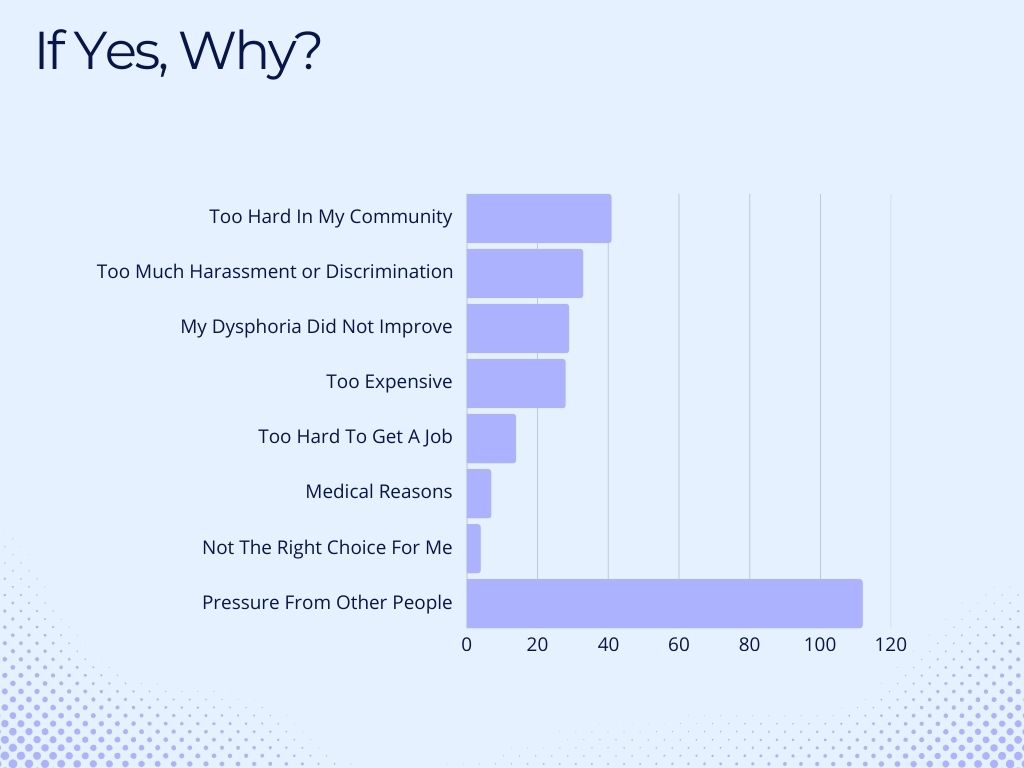
- The survey then asked the whys. Of those of us who have “gone back”
- 41% said that it was “just too hard to be trans in my community”.
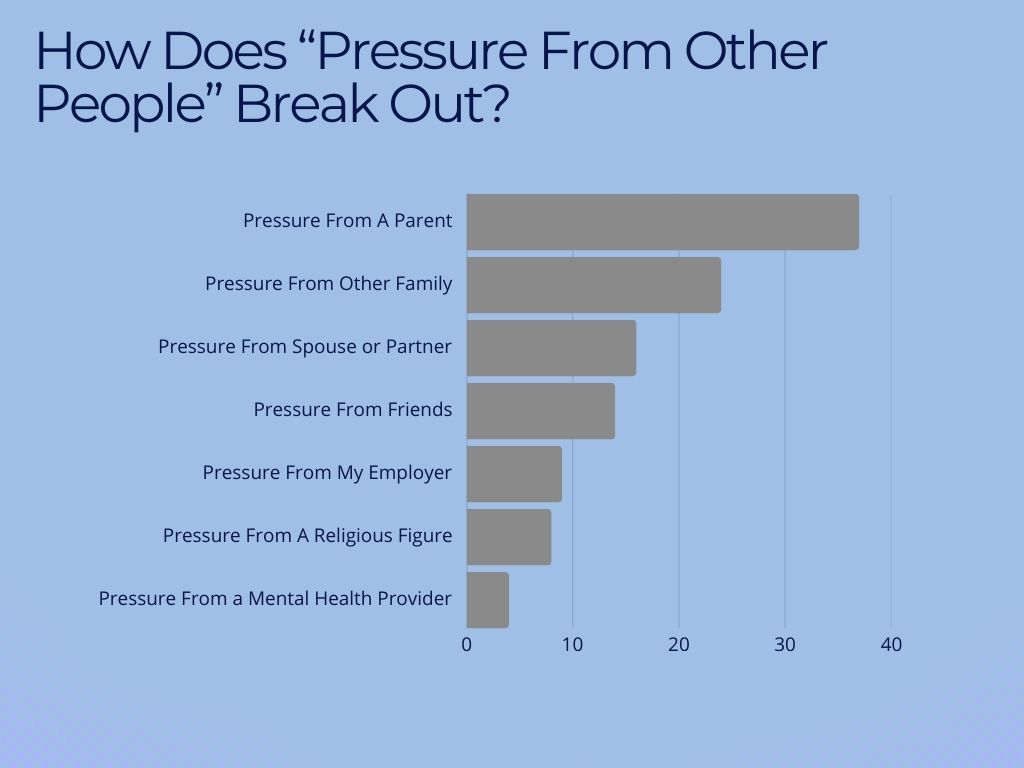
- Many of us reported that pressure from our families, employers, religious community, mental health providers, and friends were reasons why.
- 33% reported that anti-trans harassment and discrimination played a role.
- 82 percent of the 9% that answered yes dis so “because of societal and structural factors that made it difficult to be trans in their community”.
- 4% of those 9% learned that gender transition was not the right choice for them at the time.
Contrast this with WHEN FAMILY IS SUPPORTIVE, WE ARE HAPPIER and HEALTHIER! (see below)
On Our Sexual and Reproductive Health, and HIV/AIDS
Talking About Fertility and Reproductive Health
- 95% of us who saw a provider about hormones, and 85% of us who saw a provider about a transition-related surgery had a discussion about reproductive health.
- Most of those discussions happened before hormones, blockers, or surgery happened.
- NOTE: we include reproductive health, sexual health, and fertility discussions in our informed consent discussions.
Birth Control - Most of us who talked to a provider about contraception/birth control got it. 12% of us did not.
- About half of us desire access to birth control.
- 19% of us wanted birth control, but did not talk to a provider about it.
- The WHY:
- Having to go to a gendered clinic (like a “Women’s Health Clinic”
- It’s too expensive
- Fears of discrimination or privacy.
- The WHY:
Abortion
- 3% of us reported wanting or needing an abortion.
- 7% of those who wanted one had trouble getting one because of gender.
- WHY?
- Can’t find a trans-knowledgable provider.
- Didn’t feel welcome in the clinic or office
- Provider or staff refused, were discriminatory, or outright hostile/abusive.
- A quarter of us replied “other”.
- All that is NOT OK. Quality trans healthcare includes affirming reproductive care.
- WHY?
- We are more likely to be tested for HIV compared to the general population in the United States.
- We are also more likely to be living with HIV.
- Of people living with HIV, transgender women face the highest burden (2.4% of transgender women, compared to 0.3% of the general population).
- Black transgender women face the highest burden (15.5%).
On Our Mental Health and Our Experiences with Mental Health Providers
Content Note: suicidality statistics
We’ve written about minority stress before in the context of how it impacts our cardiovascular health. Mental health may be where it most clearly affects our lives..
We experience high rates of depression, suicidality, trauma, anxiety, and other mental health challenges, and it is mostly because we have to navigate multiple oppressions. For BIPOC trans folks, the burden is higher.
In the US Trans Survey,
- 44% of us meet “the criteria for serious psychological distress, compared to less than 4% of the general U.S. Population.” This is feeling sad, nervous, hopeless, restless, little interest in doing things, or experiencing low self-esteem in the prior month. The younger we are, the more we reported poorer mental health.
- Most of us (81%) experienced depression symptoms on several days in the two weeks before taking the survey.
- In the year prior to taking the survey, 38% of us considered suicide. 41% of those of us who considered suicide made plans. The rates in the general population are 5% and 1%. We are six times as likely to think about suicide.
- In our lifetimes. 78% of us considered suicide and 40% of us attempted suicide. That compares to 13.2% and 2.4% of the general population. Once again, we are six times as likely to consider suicide compared to the general population.
How Are We Supported By Mental Health Professionals?
- 58% of us participated in counseling in the year before taking the survey. That’s more than twice as many as the general population.
BUT
- While 78% of us wanted counseling for gender identity or transition, only 48% of us were able to access it.
- For 12% of us, our counselors (hah!) counseled us against our identities.
- For those of us who saw religious counselors or therapists, 50% of us received negative counseling about our identities.
Conclusions?
We need better access to therapy.
Conversion therapy is harmful.
What Do Our Families and Support Systems Have To Do With It?
- We are less likely to consider suicide when we have supportive families and networks. Affirming family and friends are protective.
On Substance Use
- We drink less alcohol and smoke less tobacco than the general U.S. adult population. Our rates of cigarette use have gone down since the 2015 survey.
- However, we use e-cigarettes/vapes more than the general U.S. adult population, and our rates have increased since 2015.
- We also use marijuana more than we did in 2015, and more than the general U.S. population.
- This might have something to do with where we live!
- The percentage of us who have ever tried illicit drugs (cocaine, heroin, LSD, inhalants) has gone down slightly since 2015 (27%). We don’t know how that compares to the general population, but 4% of us reported current use, which is equal to 2015 and the general population.
- The percentage of us who have ever taken prescription drugs without a prescription has also fallen since 2015 (26% vs 34%). 4% of us reported current use compared to 2% of the general population.
- 25% of us reported struggling with drug or alcohol use at some point in our lives. 55% of this group reports that they are in recovery (however we may define it individually).
On Happiness
Gender care builds happiness.
- Despite discrimination and barriers, 66% of us are “Very to pretty happy”. (55% pretty happy and 11% very happy!) Happiness seems to increase with age and social and medical transitions.
- But despite being “happy,” we’re not thriving. 30% of us say that we are thriving while 63% of us are struggling. 7% of us are suffering.
- More of us are suffering or struggling than compared to the general population.
And Satisfaction
- 98% of us getting trans healthcare say that it makes us more satisfied with our lives.
- 97% who have gotten affirming surgeries say that the procedures have made us more satisfied with our lives.
- 37% of us are overall satisfied with our lives.
- 59% of us are somewhat unsatisfied.
- 4% are somewhere in-between.
All numbers taken from Health and Wellbeing: A Report of the 2022 U.S. Transgender Survey, June 2025
Rastogi, A., Menard, L., Miller, G. H., Cole, W., Laurison, D., Caballero, J. R.,
Murano-Kinney, S., & Heng-Lehtinen, R. (2025, June). Health and wellbeing: A report of the 2022 U.S.
Transgender Survey. Advocates for Transgender Equality. https://ustranssurvey.org/download-reports/
We created the charts and graphs using their data.